So what next? We have wind measurements and we do have an overview of the consumption on site. We have also pre-selected a wind turbine. How do we bring this together? The analysis will have to show us whether the wind at the site can produce the power we need to cover our consumption. Ideally, it also tells us how much extra energy we need, and how much we need to feed into the grid or give to our partners in our energy community.

But we cannot predict the future, so how are we doing this? Yes, correct, unfortunately we do not have the magic crystal ball, but we believe that we can do something which comes close enough. We start from what we know: the wind speed at our location (and a bit of seasonal variation of this), and the consumption on site (and the daily variation of this during the week or at the weekend).
Let us now assume that we can generate wind speeds and power consumption every hour in one year which matches the statistical information which we know. If this is possible, we can then see for each hour how much power will be generated and consumed and whether we need more power from the grid or can sell our overproduction to someone else. This kind of simulation is explained in more detail below.
The simulation

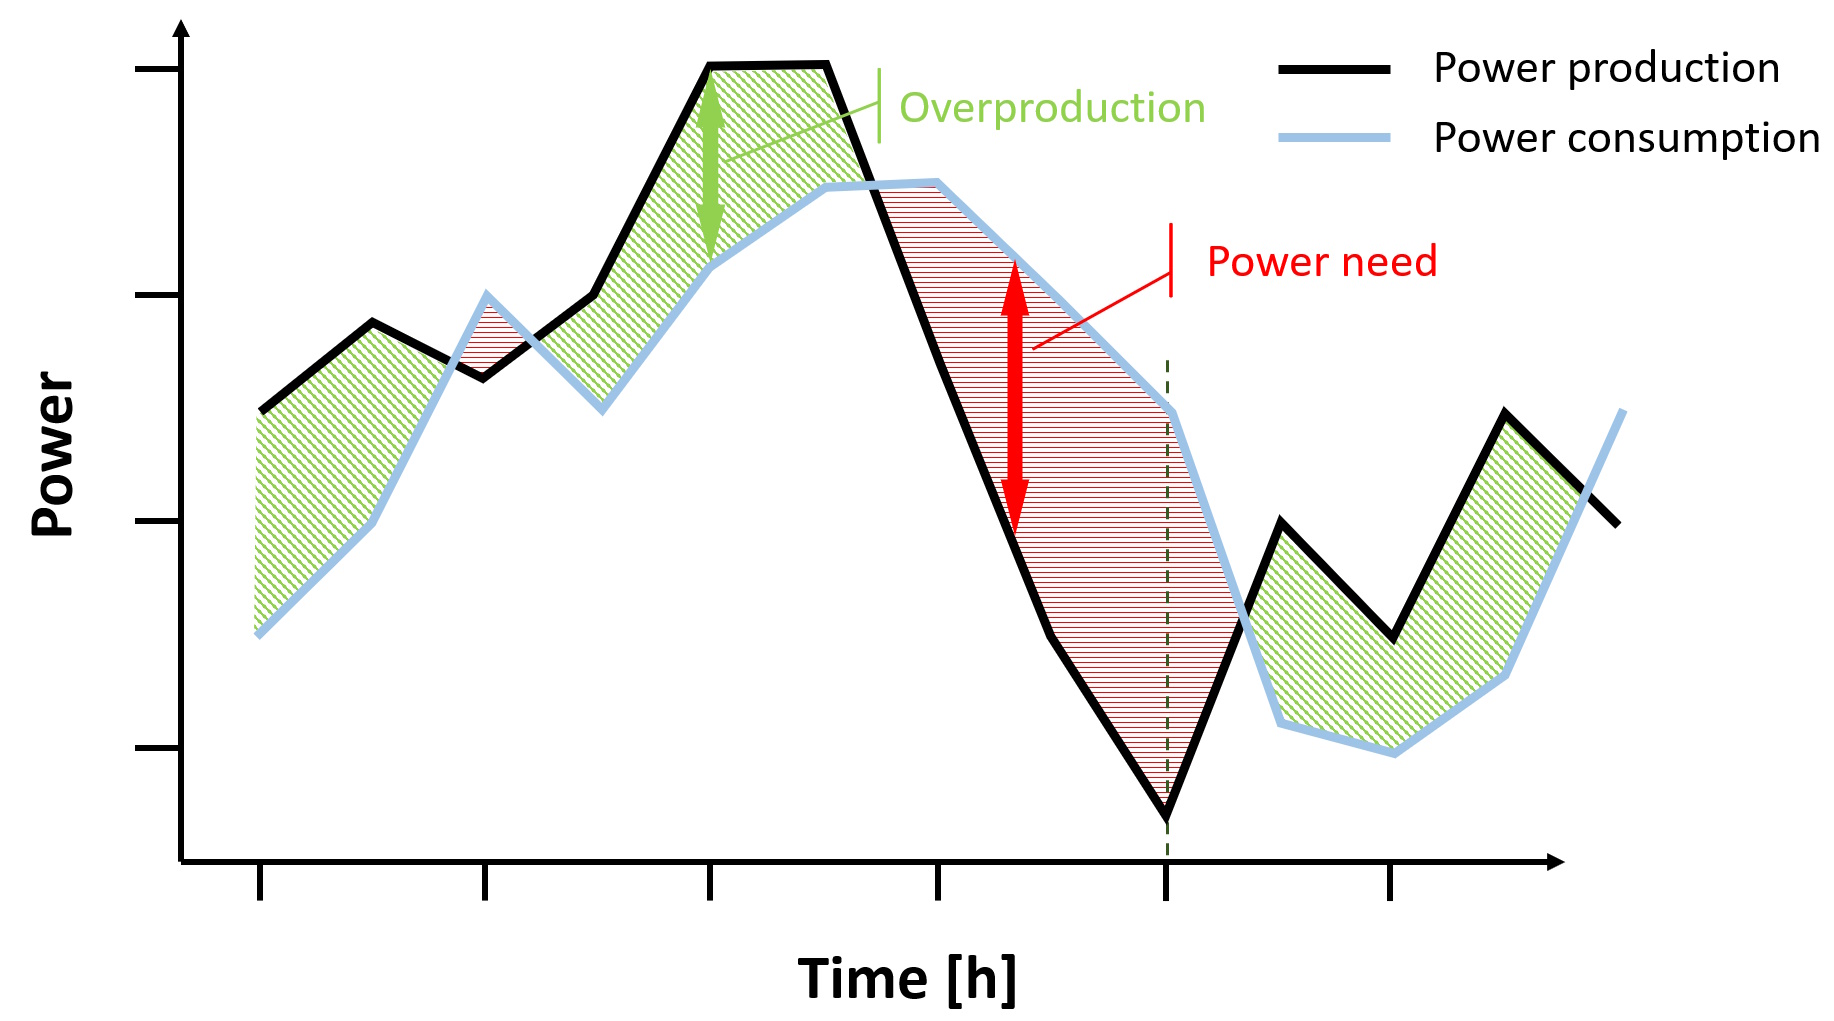
The graph on the left shows a couple of hours of this simulation. The black curve shows the power production by wind and the blue curve the consumption at the site. Overlaying these two curves provides either red areas (not enough power production) or green areas (too much power production).
In case of red areas, we need to purchase energy from the grid (like we have always done without a turbine) to have the sufficient amount. But what we purchase here is only the difference between the production and the needs (e.g. indicated by the red double arrow).
In case of green areas, we are producing too much (indicated by the green double arrow) and the excess power can, for example, be sold to our energy community, sold back to the grid, or used to charge a battery on our location.
Conclusion
So, if we are able to run such a simulation for not only a couple of hours, but a full year, we will have an overview of what we save, what we can sell, and what we still have to buy. Together with the costs for the turbine and its installation, this will tell us whether the whole project makes (financially) sense or not.
This will be discussed on one of the next pages in more detail. First, however, we need to look a bit into legislations since not everyone can just build a turbine wherever she or he wants. What are the rules and how do they differ in the regions of Belgium or in other countries? This will be outlined on the next page.
What can justASK! do for you?
justASK! can do the simulation of energy production and consumption for you. Our tools will use the data from wind measurements and your consumption data to enter into an energy simulation for one (or several) wind turbine(s). Results will show how much of your consumed electricity can come from the wind turbine and how much you will still have to buy from your energy provider. It will also tell you how much energy you can share (with another site, your neighbours, or any partner in your energy community).
justASK! will assist you in the overall analysis of your site. Using all the data together, wind, consumption, wind turbine, costs, etc., we can provide you with relevant, up-to-date information about installing wind turbine(s), incl. cost and business case analysis, legal, and engineering aspects. JUST ASK!
